
Crude Oil Price Expectations (Probabilistic & Stochastic Analysis)
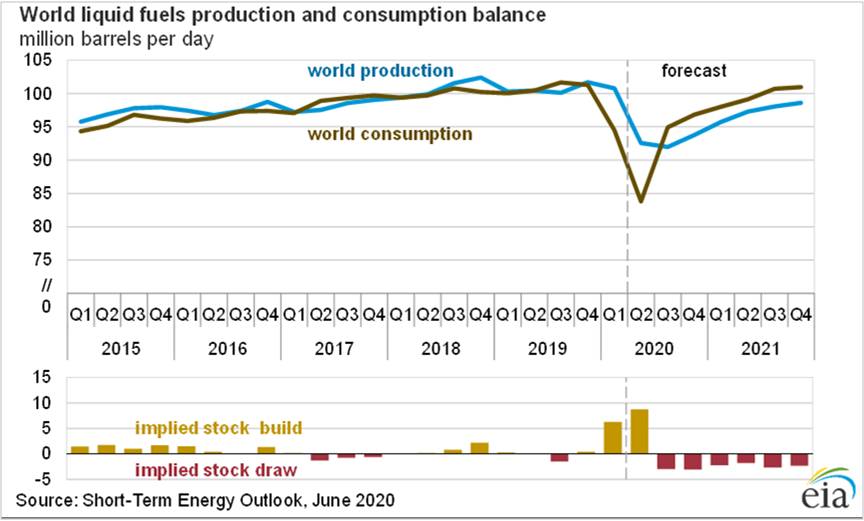
According to EIA, the demand for global petroleum and liquid fuels for the second quarter of 2020 had an average of 83.8 million barrels per day (b/d), 16.6 million b/d lower than at the same time last year. Lower demand is the result of COVID-19-related shutdowns throughout much of the world.
As stay-at-home orders are eased, EIA expects liquid fuels consumption will rise to an average of 94.9 million b/d in the third quarter (down 6.7 million b/d year over year). EIA forecasts that consumption of petroleum and liquid fuels globally will average 92.5 million b/d for all of 2020, down 8.3 million b/d from 2019, before increasing by 7.2 million b/d in 2021.
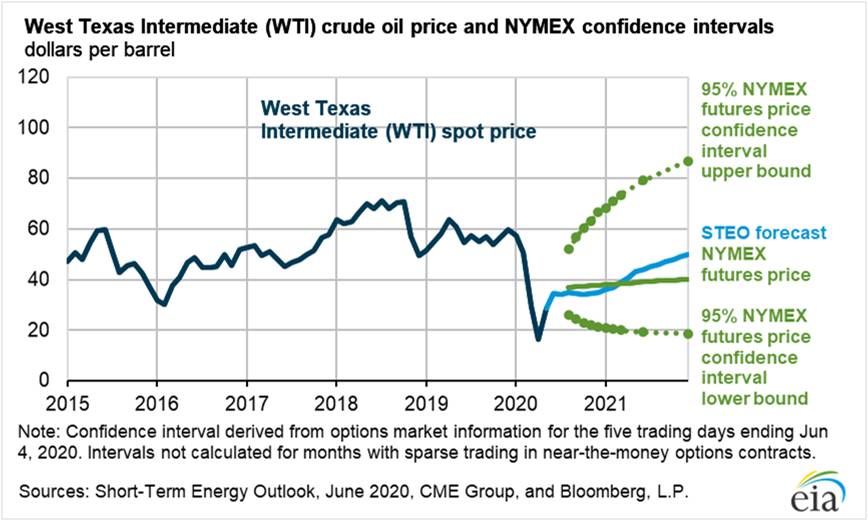
Daily Brent crude oil spot prices averaged $29 per barrel (b) in May, up $11/b from the average in April. Oil prices rose in May as initial data show global oil demand was higher than EIA had forecast and as adherence to announced production cuts by Organization of the Petroleum Exporting Countries (OPEC) and partner countries (OPEC+) was high.
EIA expects monthly Brent prices will average $37/b during the second half of 2020 and rise to an average of $48/b in 2021. The forecast of rising crude oil prices reflects expected declines in global oil inventories during the second half of 2020 and through 2021. EIA expects high inventory levels and spare crude oil production capacity will limit upward price pressures in the coming months, but as inventories decline into 2021, those upward price pressures will increase.
Source: EIA June 2020
How to Calculate the Impact of Oil Volatility on Your Business
Many businesses are directly or indirectly correlated to crude oil price variations. Such variations affect raw material costs, finished product prices, margins, services, business cycles, and so forth. A market driven and stochastic forecast is necessary to anticipate shortfalls and mitigate risk. We summarize a list of steps you should consider to include market volatilities:
- Calculate the correlation between the price of your products and that of the crude oil. Analyse the last 10 years.
- In some cases, crude price variations do not affect other businesses immediately but only after some time. There may be a lag to be considered.
- Assess how the increase / decrease in the crude oil and raw material prices affect the prices of your products and their respective gross margins.
Once you have assessed all these drivers, you can start reviewing the forecast of your company. The best way to do it is by using advanced probabilistic (stochastic¹) analysis where all the possible outputs are displayed with their respective probabilities.
Since 1986, global nominal oil prices have risen from $8.7 to $145.7, with a standard deviation of $25.7. Additionally, EIA (2010) and Shih & Yu (2010) among others, find that the log-normal distribution may simulate the behaviour of the crude oil price. The log-normal distribution not only shows the highest probability and the width of the distribution, but also shows the average volatility, indicating the whole volatility, and the standard deviations, indicating the fluctuations in volatility. Stochastic forecast and log-normal functions can be modelled using excel with @Risk (from Palisade). In the following sample, we use log-normal distributions to forecast product’s prices affected by crude oil volatility.
(1) Stochastic or random process is a probability model used to describe business phenomena that evolve over time. More specifically, in probability theory, a stochastic process is a time sequence representing the evolution of business variables / drivers whose change is subject to a random variation (Models containing a random element, hence unpredictable and without a stable pattern or order). Most businesses and open economies are stochastic systems because their internal environments are affected by random events in the external environment. Such situations need to be measured using probabilities, volatilities and standard deviations according to the profile of each variable under assessment. On the contrary, traditional valuations are static (or non-stochastic) and therefore they are far from reflecting reality and not able to show you the flow of your business.
Sample Case
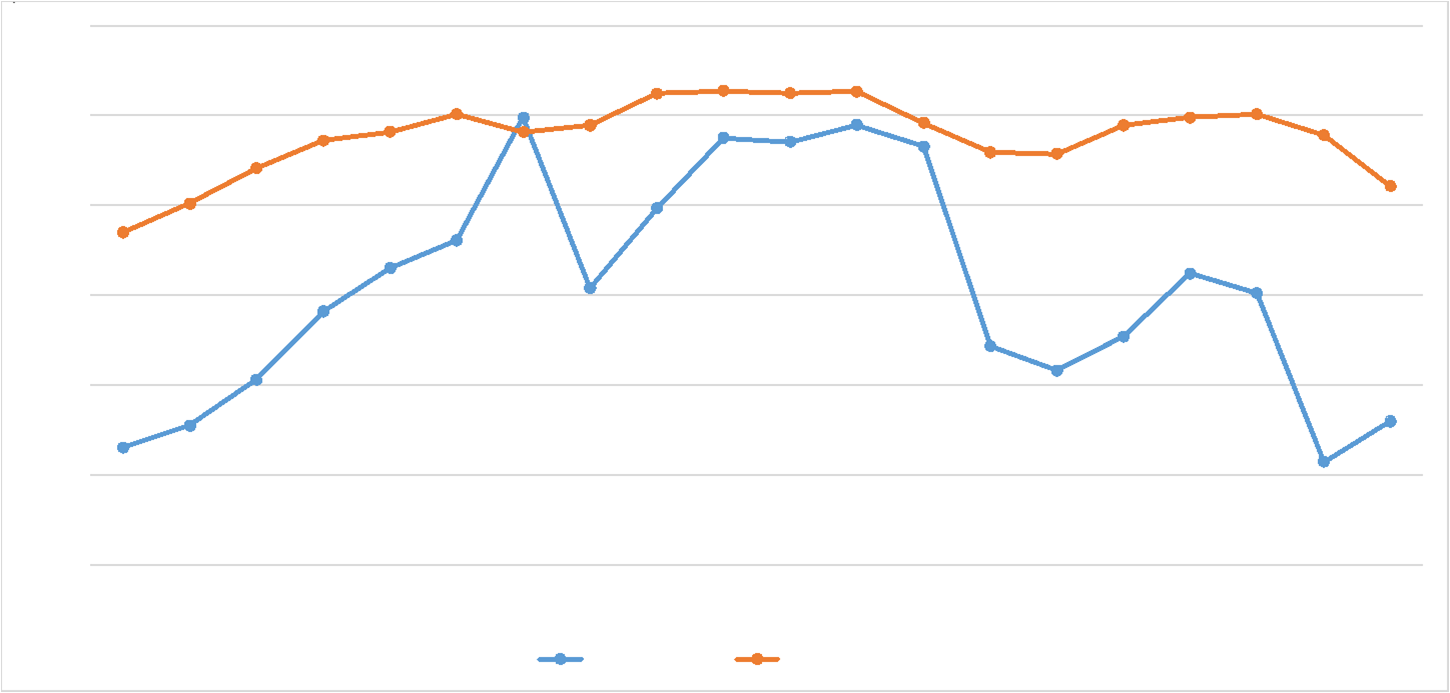
The graph below shows the price evolution of the WTI (blue line) and the hypothetical price evolution for a product AB which raw materials include crude oil. The correlation between both prices is 78% (this is a high correlation). They are not 100% correlated for two main reasons:
1. The company has other costs which are not directly dependent on crude oil including other raw materials, labour costs, etc. In this case, crude oil represents 25% of the total cost of the company (50% of total raw materials).
2. The company is not able to pass on crude oil price increases immediately and vice versa. In this case, there is a time lag of approximately 8 months.
In order to prepare the stochastic company forecast (in this case, the price of its finished product), we start calculating the following variables:
- The standard deviation of the crude oil price for the last years (excluding COVID19 period). The standard deviation is approximately 30% (between 2002 – 2019), but this will depend on the period chosen.
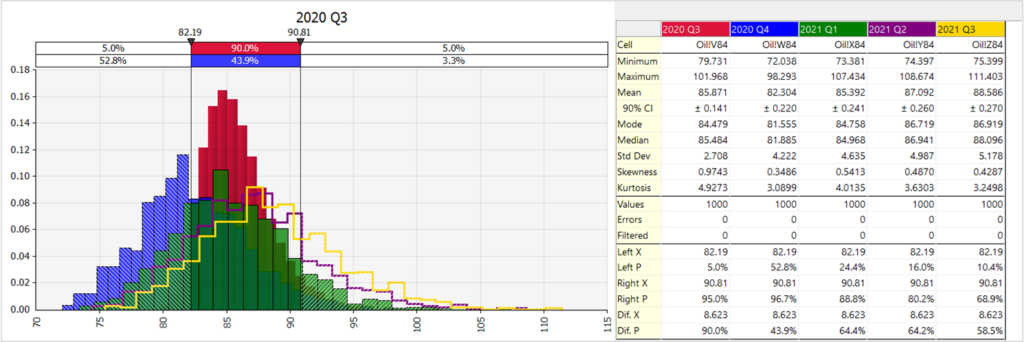
- The risk profile (probabilistic distribution) of the oil crude price. In this case, log-normal distribution (Shih & Yu, 2010).
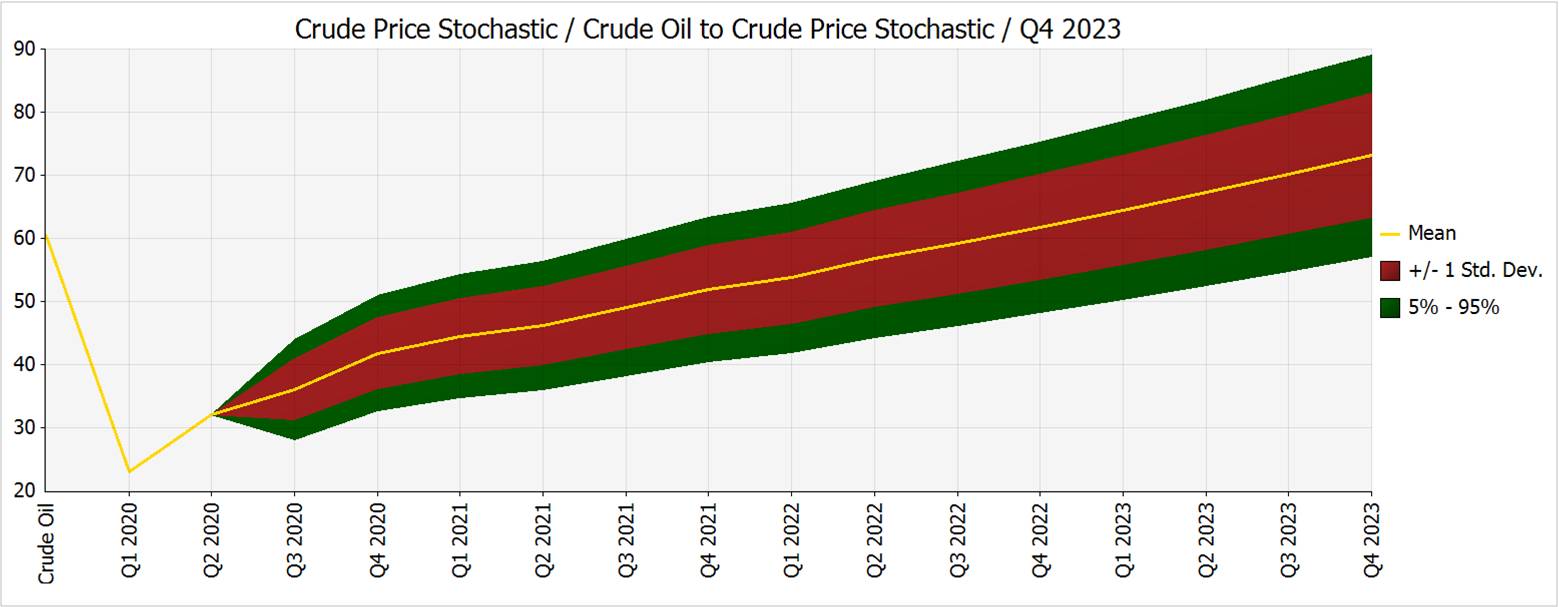
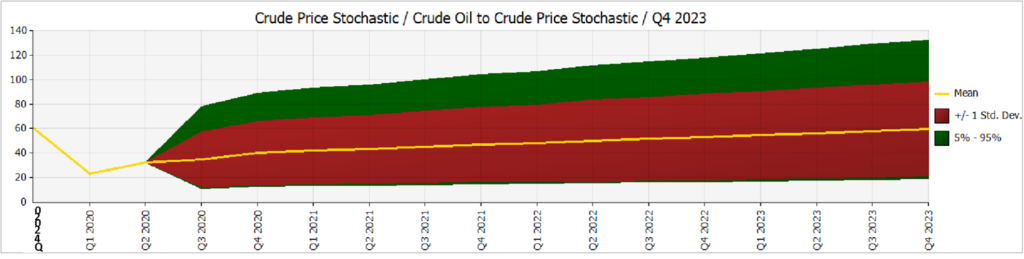
- The stochastic forecast for the crude oil price (EIA June 2020).
- The percentage of crude oil cost over the total costs for the product under analysis. In this case is 25% (50% of total raw materials).
- The time lag to pass on oil prices fluctuations to customers: In this case 8 months.
- The volatility of other raw materials.
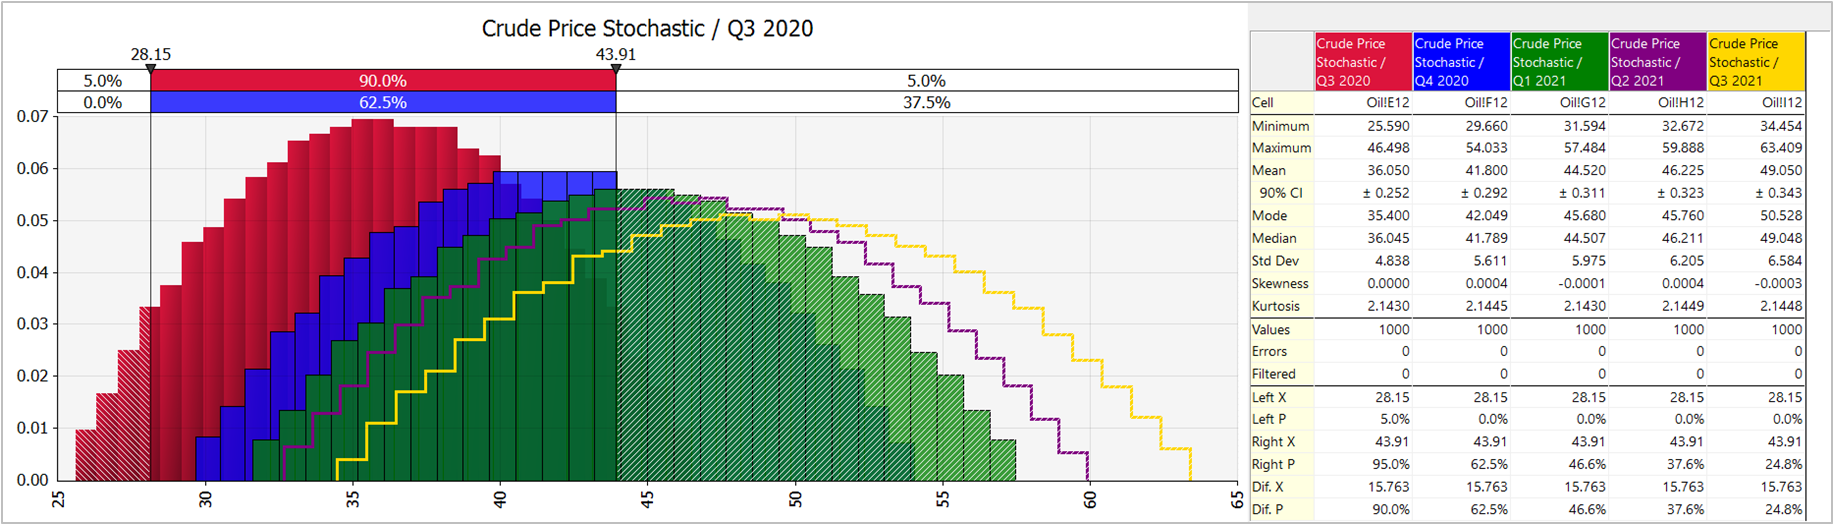
We use the EIA Forecast as the mean value of the log-normal distribution with a standard deviation of 30%. We can see the stochastic forecast for the oil crude price in the figure below and on the right.

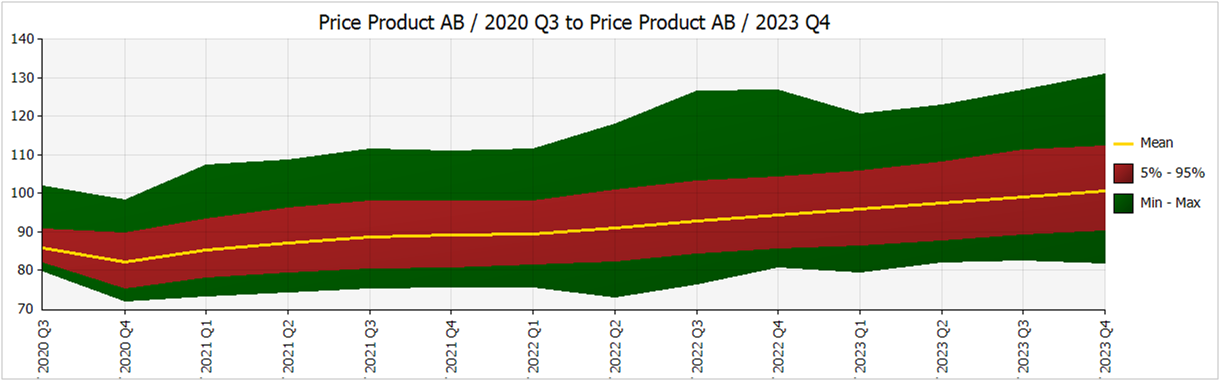
Now we proceed with the remaining steps (7,8, and 9) to simulate the stochastic forecast for the product AB’s price as shown in the figures below.
The volatility of the product AB price follows other market forces which will depend on each specific micro sector. As a consequence, the gross margin of the product AB is not constant and is affected by the variations of the crude oil price.

About the Author
Fernando Scarpati
Founder & Managing Partner of Business
Valuation International Ltd (BVint)
PhD in Valuation and Risk with more than 25 years in the Private Equity Sector and more than 500 valuations worldwide. He started his career in a top tier consulting firm continuing as Investment Director and Financial Service Director in important groups and PEs. He also holds an MBA, an Industrial Engineer degree and Bachelor’s degree in Economics and Business. As visiting Professor of business schools in Europe, he wrote many international articles in top financial journals and he is regularly interviewed and invited to speak at seminars and conferences. Fernando speaks fluent English, German, Italian and Spanish.
For more information about Advanced Valuations, write us to: info@bvint.com